Power BI – As an Investor, you might have used many tools for stock market analysis including screener, portfolio tracker etc. Most of them are online, paid or available with a set of limitations. Today I will introduce you with a powerful tool that will empower you for conducting your own stock market research and analysis. I am using this tool from past month. The name of the tool is Power BI. It is the latest Microsoft Business Intelligence Tool that provides you facility of creating own visualization and dashboard with a click of a button. Sounds Interesting right! Read On, to introduce yourself to a new world of Intelligence Power BI.
What is Power BI?
Power BI is a user-friendly, free and easy to use Business Intelligence and analytics tool provided by Microsoft. Power BI is available in various versions. For the purpose of stock market analysis, you will need Power BI Desktop. Power BI Desktop Free version can be downloaded from Microsoft site – https://powerbi.microsoft.com/en-us/pricing/
Once you download and install this tool, follow the steps given below to create your own dashboard and report for stock market analysis.
Also Read – Top 5 Best Stock Screener for Indian Stock Market
How to use Power BI for Stock Market Analysis?
On opening PBI tool for the first time, you will be asked to register with your e-mail ID. You need to do registration only once.
After launching PBI desktop, you will be prompted to “Get Data”.
Data Source
On clicking “Get Data”, you will be taken to a tab where you can give your data source. Power BI supports multiple data sources like MS Excel, Text, XML, SQL Database, website etc. In this post, we will take a popular stock market website – Money Control as a source to pick up stock market data for analysis. The main reason for selecting website as a source is doing analysis on the dynamic data. This means if data on the website gets changed your dashboard report also reflect the changes.

In Get Data click on Web option and press connect button. It will ask the URL. You can use any URL from which you want to fetch data. In this example, I have use source as Money Control website URL- https://www.moneycontrol.com/stocks/marketinfo/marketcap.php?optex=BSE
On feeding this URL, it will provide you data along with table given on URL. Select the Table and press the Load button.
Data Massaging
Once data is loaded next step is Data Massaging. It is nothing but altering and making data ready as per your requirement.
Click on Edit Queries button from the top navigation and you will be taken to query editing mode.

Make the changes as per requirement. In example data you need to split column and remove unnecessary data from the column – Company Name. Extra data you need to remove is text called as “Add to Watchlist Add to Portfolio”.
Now go back to the main page by clicking Close and Apply.
Also Read – 5 Stock Screener Websites for Fundamental Analysis in India
Selecting Visualization and Applying Logic
Next step is the selection of Visualization. Prior to making selection decide what you want to display on the dashboard.
Let’s take an example you want Top 10 companies with the highest market capitalization.
To do this go to the main report page and select visual from visualization.
First, select Table visualization and click on “Company Name” and “Market Cap” from Fields. You will be able to see the data in table format.
Now click on visualization of your choice. In this example, I have selected a clustered bar chart.
Once you see the visualization you can change color, font size and add text box as a heading.
Creating a Dashboard Report for stock market Analysis
In above example, we have created a visual of Top 10 Companies with market capitalization. Now let’s take a look at another example.
Top 10 Stocks by EPS
After data alteration go back to the main report page and select visual from visualization.
First, select Table visualization and click on “Company Name” and “EPS” from Fields. You will be able to see data in table format.
Now select visualization, I have selected Donut Chart. After selection of visual go to Filters and under visual level filter select “Top N”. Under Show items enter 10 and drag EPS filed under By Value. Click on apply filter. You will be able to see only Top 10 Stocks by EPS.
You can change visualization colour font as per your requirement.
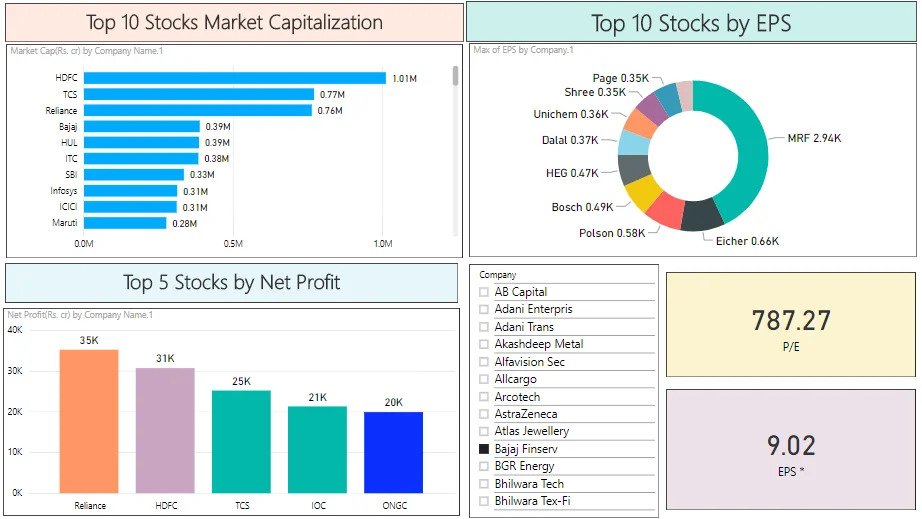
Know EPS and PE ratio by Filter
In order to know EPS and PE ratio together you need to use Slicer visualization. The step of getting data and altering would be similar to above.
Once you have data in required format select Slicer visualization and click on “Company Name” from Fields. You will be able to see company names in filter format.
Now as we need to see EPS and PE ratio, select two more visualization. I have used Card visualizations for display.
Now drag EPS and PE from Fields and you are done with your first Dashboard in Power BI.
Conclusion –
Power BI is powerful tool that can be used of making dashboard and report for stock market analysis. Apart from that you can also make Power BI dashboards about your investment, stock portfolio, profit and loss etc.
The dashboard visualization will help you in taking right decision about Investment.
You can download sample Power BI dashboard from the link given here – Stock Market Power BI Dashboard.
If you like this post, don’t forget to share it with your friends and colleagues.
Don’t forget to subscribe to this blog. Stay Tune for more Power BI ready made Dashboards.