Blog Page 374

5 Technical Screener Websites for Technical Analysis in India

What is a technical screener website? How it will help you? A Technical Stock screener is a tool for technical analysis of the stock. This tool is used by most of the stock traders. We have already discussed technical analysis. Technical analysis is the science of predicting stock price movement based on market trends, past price performance,e and volume of the stock. You don’t need to spend a fortune on fancy tools to chart your journey. Technical screener websites are here to save the day, helping you make informed decisions with detailed charts, indicators, and even pre-built screeners. In this post, I will share information about the 5 Technical Stock Screener website.

Technical stock screeners are of two types. One is the live technical stock screener and the second is the end-of-day technical stock screener. Today our focus will be on end of day screener.

Technical Screener Websites

5 Technical Screener Websites for Technical Analysis in India

TradingView – The All-in-One Powerhouse

If there’s a superhero in the world of technical analysis, it’s TradingView. This platform isn’t just popular in India; it’s a global favorite. And for good reason!

TradingView offers an intuitive interface, a rich library of indicators, and the ability to customize your charts to suit your trading style. Whether you’re into day trading, swing trading, or long-term investing, this platform has something for you.

  • Why It Rocks:
    • Over 100+ built-in indicators and a vibrant community creating custom ones.
    • Advanced charting tools with real-time data.
    • Social features: Follow other traders, share your analysis, and learn from the community.
  • Best For: Beginners to advanced traders.

The free plan is generous, but the paid versions (starting at ₹1,200/month) unlock additional perks like multiple chart layouts and intraday data for Indian markets.

5 Stock Screener Websites for Fundamental Analysis in India

Trendlyne

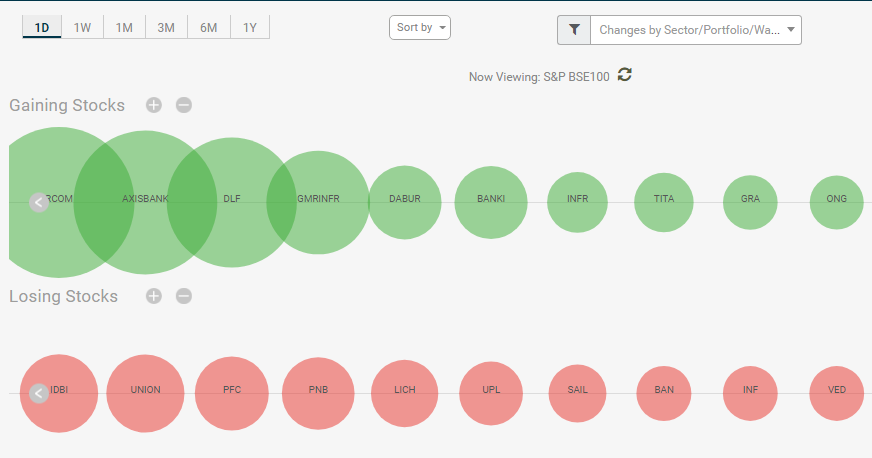
Trendlyne is second best technical screener available for Indian Traders and investors. Trendlyne provides all market news and stock market indicators. The key features of Trendlyne are given below.

  • Stock heatmap with customization option
  • Market dashboard
  • Personalized Screener
  • Technical score
  • Average Broker Target

After logging to Trendlyne website, enter the name of the stock in the search tab and press a search button. You will be taken to a page where you can find information like technical score, simple moving average, and brokerage target.

technical screener

 Chartink Screener – Fundamental and Technical Scanner

StockEdge – The Indian Market Specialist

StockEdge is like that friend who knows all the local gossip—except it focuses on Indian markets. It’s designed specifically for Indian traders and investors, making it a must-have tool if you’re serious about domestic stocks.

  • What Makes It Shine:
    • Predefined technical scans for various strategies like moving averages, RSI, or Bollinger Bands.
    • Easy-to-use filters to screen stocks by technical parameters.
    • Learning resources, including webinars and courses for beginners.
  • Why It’s Unique:
    StockEdge focuses on simplicity, so even if you’re new to technical analysis, you’ll find it easy to use. The paid plans start at ₹499/month, making it budget-friendly too.

  Technical Analysis or Fundamental Analysis – Which is better?

Chartink – The Screener King

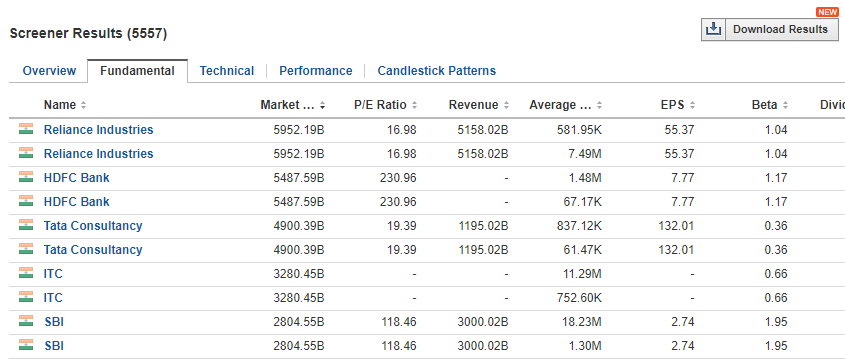
Chartink is like the Swiss Army knife of screeners. This platform is purely focused on screening stocks using technical and fundamental criteria. It’s especially popular among traders who love creating custom screeners.

  • What’s Cool About It:
    • Create your own screeners using simple codes or choose from thousands of pre-built ones.
    • Real-time screening for Indian stocks.
    • Alerts to notify you when a stock meets your criteria.
  • Pro Tip:
    While it’s free for basic usage, the premium plan (₹999/month) unlocks faster scans and additional features, which can be a game-changer for active traders.

TickerTape – The New-Age Contender

TickerTape is the cool, modern kid on the block. While it’s primarily known for its fundamental analysis features, its technical screener tools are nothing to scoff at. Plus, it integrates beautifully with brokers, making execution seamless.

  • Standout Features:
    • Screen stocks based on technical parameters like moving averages or MACD crossovers.
    • A clean and modern interface that’s easy on the eyes.
    • Insightful visualizations to make data interpretation a breeze.
  • Why Pick TickerTape:
    If you want a platform that balances simplicity with functionality, this is it. The premium plan starts at ₹118/month, which is an absolute steal.

Tips to Get the Most Out of These Screeners

  1. Know Your Strategy: Are you a day trader or a long-term investor? Pick a platform that aligns with your approach.
  2. Experiment: Start with free plans, explore the features, and only upgrade if you really need the premium tools.
  3. Stay Updated: Markets evolve, and so do these platforms. Keep an eye out for updates or new features.

Over to you –

The stock market isn’t just about luck; it’s about preparation. And these technical screener websites are like your personal trainers, helping you stay in shape for the next market opportunity. Whether you’re analyzing nifty trends or diving deep into mid-cap gems, having the right tools can make all the difference.

Now, the question is: Are you ready to take your trading game to the next level?

FAQs

1. Are these technical screener websites beginner-friendly?

Yes! Platforms like StockEdge and TickerTape are especially user-friendly, making them ideal for beginners.

2. Can I use these screeners for free?

Absolutely. Most of these websites offer free versions with essential features. However, upgrading to paid plans unlocks advanced tools.

3. Which screener is best for day trading?

TradingView and Chartink are excellent for day trading due to their real-time data and customizable alerts.

4. Do these screeners support cryptocurrency analysis?

TradingView support crypto analysis in addition to stocks, making them versatile options.

5. How often should I use these screeners?

It depends on your trading style. Day traders may use them daily, while long-term investors might check them weekly or even monthly.

With these tools in your arsenal, the stock market doesn’t have to feel like a labyrinth. Ready to make informed decisions and chart your success?

Technical Analysis for Buying and Selling Stock

Technical Analysis

What is Technical Analysis? How to do Technical Analysis of the stock? A Technical analysis is a science of predicting stock price movement based on market trend, past price performance and volume of the stock. In layman term, best analogy of technical analysis would be weather forecasting. Weather forecasting is a method of forecasting weather condition, whereas in technical analysis is a method of predicting stock price condition.

Technical analysis can help the investor to know what is likely to happen to the price over the time. Technical analysis is a widely used method by traders. Technical Analysis (TA) is done for stock, indexes, commodities, future or any other tradable instruments where historical price data and supply-demand data is available.

Also Read – 5 Technical Screener Websites for Technical Analysis in India 

How to do Technical Analysis of the stock?

Technical Analysis is complex in nature. There are multiple methods used for doing TA. However, in this post, we will take a look at a glimpse of following methods.

  • Chart Pattern Study
  • Trend Analysis
  • Moving Averages
  • Supply & Demand
  • Support & Resistance

Before starting TA you need to zero down to stock. You can use your own method to zero down to stock or may consider factors such as trends, volume, support, resistance etc. The first thing you need to do is plot historical price movement on a two-dimensional chart. Once price chart is ready our analysis begins.

Chart Pattern Study

Chart Pattern Study is a most complex method. It involves a study of multiple patterns. The theory behind chart pattern is based on assumption that pattern consistently reappears and produce the same trend in future. Chart pattern gives idea about future stock price. However, please note that chart pattern study does not give a full proof result. Few popular chart pattern used for analysis are Head and Shoulders, Cup and Handle and Tringle pattern.

Trend Analysis

Trend Analysis is important. But it is difficult as market never moves in one direction. A stock will never rise continuously or fall continuously on a given day. Generally, high volumes and increasing price indicate upward trend, whereas lower volumes and low price indicate a downward trend. The trend is generally influenced by news. A Recent example is SBI stock where stock moved upward by more than 25% due to news of pumping money in public sector bank by the government. Doing intraday trading based on only trend analysis could be a risky affair.

Read –Technical Analysis or Fundamental Analysis – Which is better?

Moving Averages

Moving average is a most popular tool among traders. It is also known as DMA (daily moving average analysis).In this method, you need to plot 200-day moving average on the price chart. When the price of a stock rises above daily moving average line it is single to buy the stock. When the price fall below daily moving average it is time to sell the stock. 200-day moving average is just an example you can even do 100, 50 or 10-day moving average analysis of the stock.

Supply & Demand Study

Movement of price happens due variation in supply and demand. So, another simple method used for technical analysis is Supply & Demand study. Buying and selling calls in this method depend on a number of buyer and sellers. If a number of sellers are less demand of stock will be high and hence price is likely to increase. On the opposite end if sellers are more stock price is likely to decrease.

Support & Resistance

Support & Resistance is alternative terms used by expert many times while recommending a stock. In this method, you need to plot support and resistance of the stock on the chart and find out how price movement is taking place. In this method, if a stock falls below support level it may fall future. On the other hand if stock cross-resistance level it is likely to increase further.

Also Read – Top Debt Free Companies in India for Investment

Over to You –

I have only shared the technical analysis methods which are known to me. There are multiple other methods used by traders for doing technical analysis. However, I have applied above method while doing stock trading and it works.

Remember – Trading is a risky game like snake and ladders, where your dice (method) decide that you will be getting snake or ladders. You have to use your own method to decide which method and parameters suits you the best.

Download EPF Passbook via Umang App

EPFO services are now available on the Umang App (Unified Mobile APP for New Governance). Umang App allows you to download EPF passbook on the move. Umang is a single app for availing various government services. The services offered by Umang Include Passport Seva, DigiLocker, EPFO services, NPS etc. You can download Umang App from App stores such as Google Play and iTunes. In this post, I will share details about How to Download EPF Passbook via Umang App.

How to Download EPF Passbook via Umang App?

Step-1

First download and install Umang App on your smartphone via app store or website. When you open the app you will be prompted with language selection. You have the option to select multiple languages as this app support multiple languages.

Step-2

The next step is to provide your mobile number for the registration. Once you provide your mobile number app will generate OTP for the verification.

Also Read – How to Update EPF KYC Online?

Step-3

After OTP verification you need to provide MPIN 4 digit numeric number to protect your Umang Account against unauthorized access. After providing MPIN this app will ask security questions for recovering account.

Step-4

Next step is to provide your Aadhaar Details and Profile information. Please note that It is not mandatory to give your Aadhaar information you can skip this step.

Step-5

Once you are done with above step screen will display tabs of various services like EPFO, NPS, ePathshala, Bharat Gas, Kishan Suvidha etc.

In order to download EPF passbook click on EPFO icon. The app will display three tabs General Services, Employee Centric Services and Employer Centric Services.

Click on Employee Centric Services. Here you will be able to see View Passbook and Raise Claim section. Click on View Passbook section and provide your UAN number. OTP will be sent to your mobile number registered with EPF account.

Enter OTP and you will be able to see your passbook. Just scroll down and you will be able to see an option to download passbook in PDF format.

Download EPF Passbook Umang App

Also Read –E-Nomination Facility EPFO Portal

Other EPFO Facilities provided by Umang App

Apart from viewing and downloading EPF passbook, this app can also be used for the following purposes.

  • Raise EPF withdrawal claim
  • Track Claim
  • Search Establishment
  • Search EPO Office
  • Know your claim status

Umang App is a wonderful app that provides access to almost every e-Gov services ranging from Central to Local Government bodies and other citizen-centric services.

As per me, this wonderful facility of downloading EPF Passbook on the move.

I hope the information given here will help in downloading EPF passbook.

5 Stock Screener Websites for Fundamental Analysis in India

What is stock screener website? How it will help you? A stock screener is tool used for fundamental analysis of the stock. I have already discussed about How to do Fundamental Analysis of the stock? In this post, I will share information about 5 Stock Screener websites.

Stock screener tool will help you in doing analysis and research. On Screener tool, you can filter stocks based on key parameters and metrics such as stock price, market cap, dividend yield and many more parameters. These stock screener website will surely help you in doing Fundamental Analysis of the stock.

10 Best Stocks to buy for the long term

5 Stock Screener Websites for Fundamental Analysis in India

Google Stock Screener

You may be surprised to note that Google is also providing Stock Screener Facility. The key features of Google Screener are given below.

  • Google Stock Screener facility is free to use.
  • Google Screener gives facility to compare the stock with peer stock along with parameters.
  • You can export data given on Google Screener.
  • It provides coverage to both BSE and NSE.
  • You also have criteria option to choose your own criteria of stock screening.

After logging to Google Stock Screener website, you need to input company name in the search query and press search button, you will be taken to a page where you can find all parameter and interactive price movement chart. You can also compare the stock with peer stocks in terms of various parameters such as EPS, PE ratio, market cap, price to book ratio, dividend yield etc. You can also create a portfolio by clicking on Add to portfolio button.

Screener.in

The Screener is a stock analysis and screening tool to see information of listed Indian companies in a customizable way. The key features and facility provided by Screener.in are given below.

  • A Screener is a free tool for analysis.
  • You can create your own watch list. You can even customize your screen.
  • You can get a readymade quarterly comparison of last 12 quarters.
  • Screener provides Exhaustive comparison of an annual result.
  • This website also gives peer comparison.
  • Analysis section of this website gives a brief analysis. It helps investors in taking an informed decision.

Chartink Screener – Fundamental and Technical Scanner

On screener website, you need to input company name in the search query. You will be taken to the page showing charts along with complete information about the stock. It is also possible to export this data provided you have registered with the website. Registration on this website is free.

Investing.com

Investing.com is third stock screener website. Investing screener is also free. The features and facility provided by Investing tool are given below.

  • This website offers sector wise and exchange wise option.
  • You can have watchlist and alert mechanism for a specific stock.
  • This tool is free to use.
  • You can have customized screen option in this tool.

5 Technical Screener Websites for Technical Analysis in India

In the stock screener section, you need to select a country, exchange, and sector. On the selection screener will display results. You can get various readymade tabs like Fundamental, Technical and performance analysis. As per me, it is a fantastic website for stock analysis.

investing stock screener

Moneyworks4me.com

Moneyqorks4me is paid stock screener tool. It gives a complete in-depth analysis of the stock. The key features of this tool are given below.

  • Peer comparison & performance history of stock
  • Stock investing Game
  • Future Prospects
  • Stock price calculator

Among all section of Moneyworks4me, I like 10 year X- Ray. It is a free feature. In this, you can find last 10-year financial report in a user-friendly format. It gives red, green and yellow indication about the stock. A sample report for Avanti Feed stock is given below.

It is unique scanner compare to other. They have their own set of calculations and historical comparison by which they rate stock. They also have a unique concept of stock price calculator and MRP of stock. However, it falls under the advance facility and you need to pay money for using this facility.

Technical Analysis for Buying and Selling Stock

GuruFocus

GuruFocus is the last screener in the list. GuruFocus is also paid tool. It does complex analysis and claimed to be a very good tool. The facility and feature provided by GuruFocus is given below.

  • It is a paid tool designed for professionals
  • Guru Based Picks
  • Investor Insider
  • Ideas, Research, Guru’s Speak and Interviews

This screener covers almost all fundamental points. This tool also has option which includes sophisticated filter and calculations. I have not used this tool anytime for doing an analysis.

Over to you –

A screener is must tool if you are buying a stock after doing the analysis. All free screener tool gives very good facility for analyzing a stock. However, in the free screener, you need to perform analysis on your own.

A paid tool moneyworks4me and Guru Focus gives readymade analysis/report. However, it comes with money. If you are part-time investor I would recommend using a free tool such as screener.in.

Feel free to post your queries in the comment section.