Fundamental and Technical Analysis Scanner or Screener are widely used tools by stock market experts. The Stock Scanner tool helps investors and traders in doing fundamental and technical analysis. On the scanner tool, you can filter stocks based on various parameters such as stock price, daily moving average, market cap, dividend yield, and many more.
I have already discussed 5 Stock Screener websites for doing fundamental analysis of the stock. In this post, I will share information about Chartink Screener. Chartink is the most popular stock screener website that provides both fundamental and technical screener tool. It also provides a facility to generate SMS and E-mail alert. Let’s take a quick look at Chartink Scanner.

Chartink Scanner – Fundamental Analysis Filters
Readymade Fundamental Analysis Filter
Chartink Provides multiple readymade fundamental analysis filters. To access fundamental scans kindly visit – https://chartink.com/screeners/fundamental-screeners
You will be able to see readymade category-wise scanners. To find a specific scanner enter your query in the search tab and press Search scans. It will show relevant scanners associated with your search query.
How to create your own filter for Fundamental Analysis?
It is easy to create your own customized filter using the Chartlink website. Let’s try to understand the process by example.
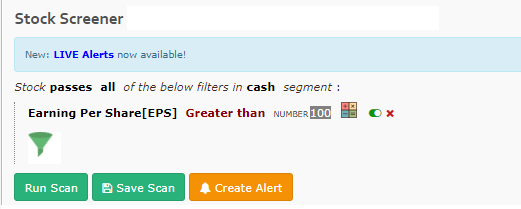
Example -1 Suppose you want to find out and compare Stock with the Highest EPS.
- The first step is going to the Screener tool.
- From the navigation, tab click on “Create Scan” under the scanners tab.
- Click on the green color funnel – Filter icon.
- Select “Earning Per Share [EPS]” from a drop-down menu.
- It will automatically open another menu where you need to select “Greater than”
- Now enter the value of EPS.
- Next is to press the Run Scan button.
- It will display all stocks with EPS greater than a value specified by you.
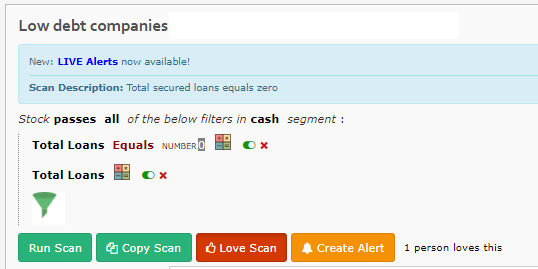
Example -2 Suppose you want to find out low-debt companies.
- Visit Chartink screener tool.
- Click on green color funnel – Filter icon.
- Select “Total Loans” from a drop-down menu.
- Next is select “Equals” and enter number 0.
- Press Run Scan button and you will be able to see debt-free companies on the screen.
Chartink Scanner – Technical Analysis Filters
Technical Analysis filters help you to do technical analysis. You can find many things such as candlestick scans, buy/sell signal, a stock with rising/falling price, increase in volume, bullish golden cross scan, technical breakouts, etc.
How to create a filter for Technical Analysis?
Example -1 Suppose you want to find High Volume Stocks.
- The first step is going to the Screener tool.
- From navigation, tab click on “Create Scan” under scanners tab.
- Click on green color funnel – Filter icon.
- Select “Volume” from a drop-down menu.
- Now select “Greater than equal to” and Enter Number.
- Press Run Scan button and you will be able to see all high-volume stocks on your screen.
Chartlink Scanner – How to create and configure alert?
You can also configure SMS or E-mail alert for all these reports.
To configure alerts, you need to click on “Create Alert” button as shown in the screenshot below.
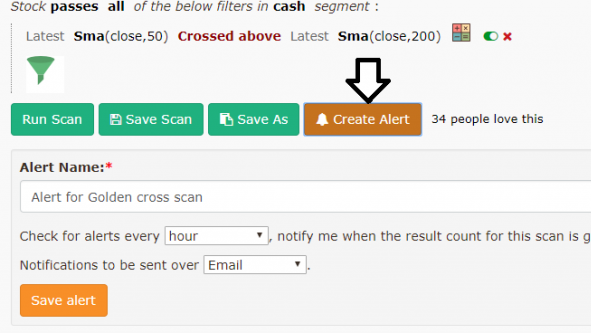
However, it is a premium facility and you need to pay money for the same. The monthly cost for this facility is Rs.750.
You can configure to run alerts every 5/10/15/20/30/60/120/240 minute & on a daily, weekly or monthly basis. Alerts can also be configured to run after the market close & open.
Do you think Chartink Scanner for Fundamental or Technical Analysis is helpful?
Make sure to share this post, with your friends and collogues and on social pages like Facebook & Twitter.