Chart patterns are a subset of technical analysis (TA). Delving into the intricacies of technical analysis (TA), chart patterns stand as a pivotal subset demanding attention for those navigating the complex terrain of the stock market. These patterns not only serve as a compass but also delineate the course of action one should undertake in the ever-shifting landscape of financial markets.
Embarking on a journey into the realm of chart patterns, it becomes evident that these graphical representations wield a profound influence on strategic decision-making. The amalgamation of short and extensive sentences mirrors the ebb and flow of market dynamics, a characteristic often more nuanced in human-authored content compared to its artificial counterpart.
Let us embark on a cerebral exploration of these enigmatic patterns, with a commitment to providing a comprehensive understanding of their nuances. As we navigate this labyrinth of financial insight, be prepared for a revelation that transcends the ordinary.
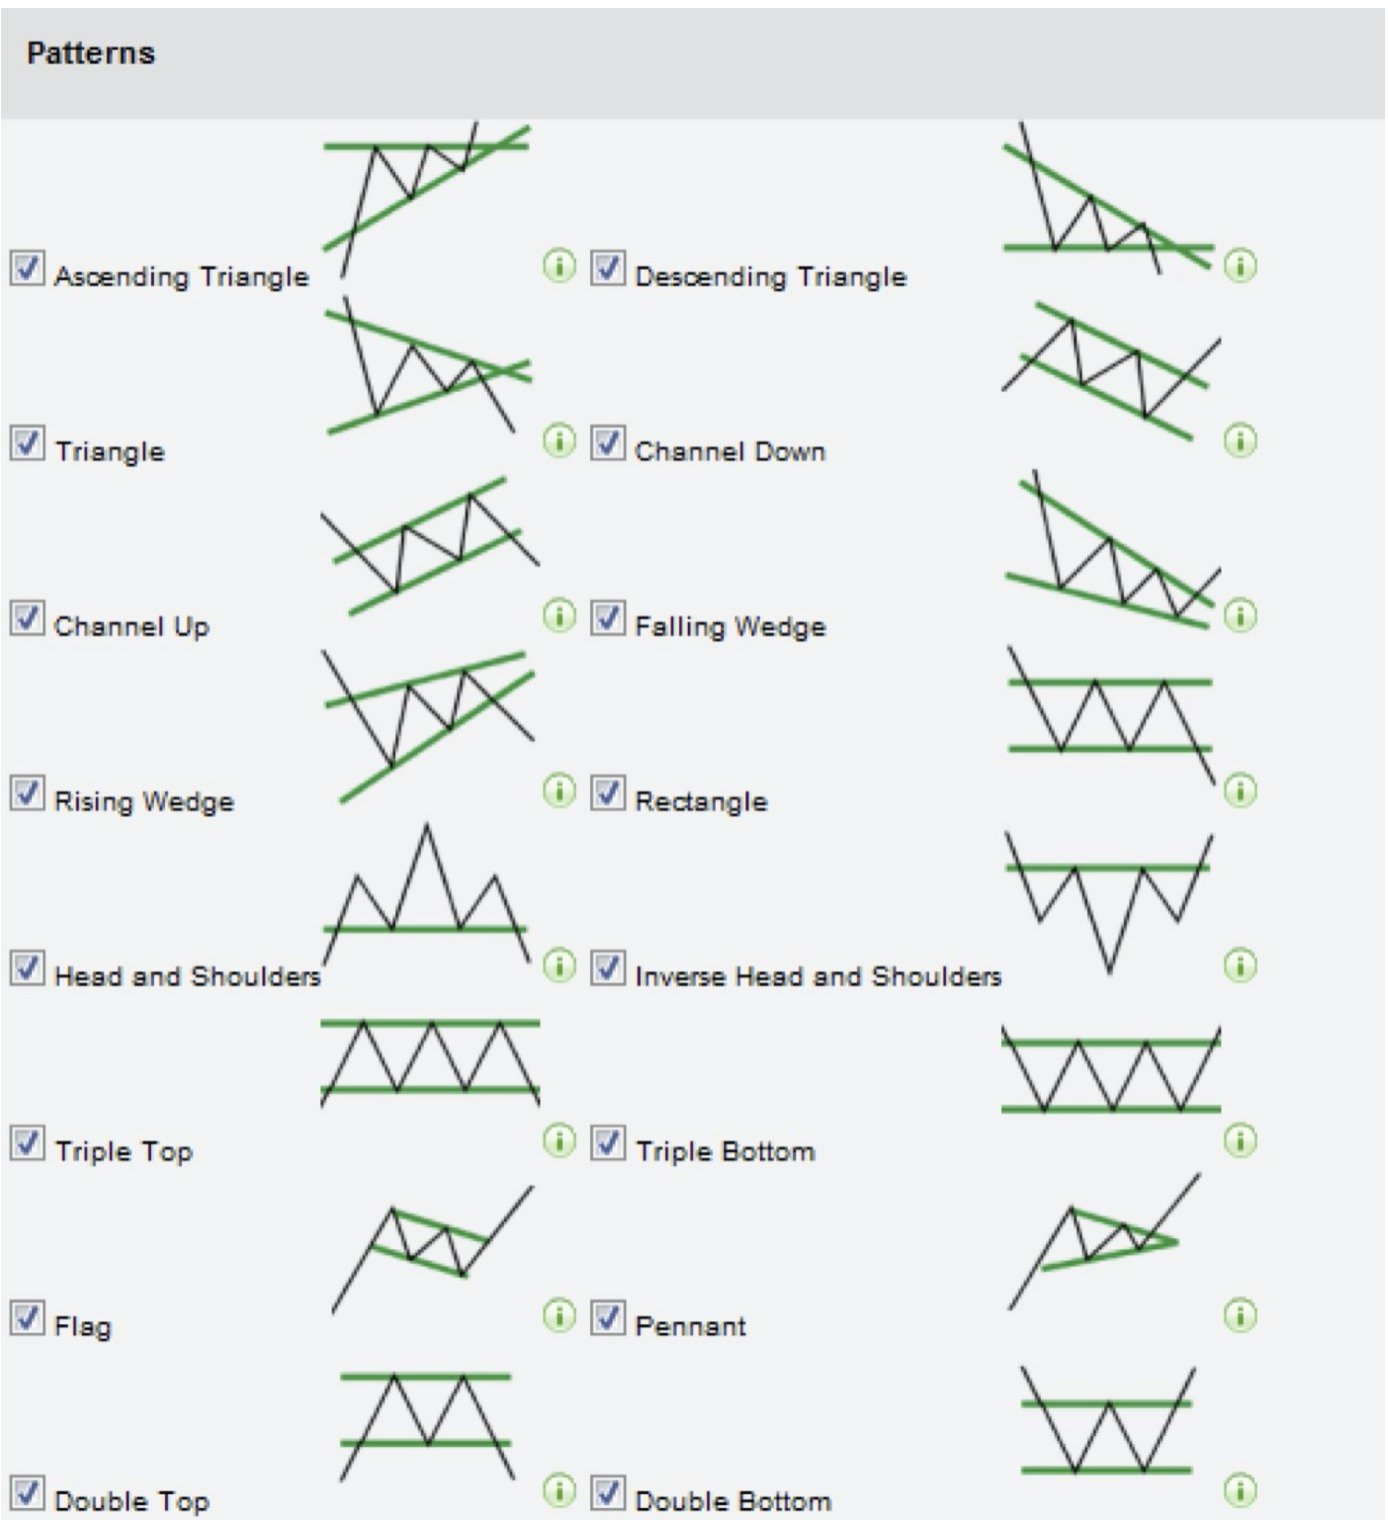
15 Common Trading Chart Patterns
#1 Tringle
Triangles are among the most popular chart patterns used in technical analysis since they occur frequently compared to other patterns. The three most common types of triangles are symmetrical triangles, ascending triangles, and descending triangles. These chart patterns can last anywhere from a couple of weeks to several months.
#2 Ascending Triangle
An ascending triangle is a chart pattern used in technical analysis. It is created by price moves that allow for a horizontal line to be drawn along the swing highs and a rising trendline to be drawn along the swing lows.
#3 Descending Tringle
A descending triangle is a bearish chart pattern used in technical analysis that is created by drawing one trend line that connects a series of lower highs and a second horizontal trend line that connects a series of lows.
#4 Channel Down
The Channel Down pattern is identified when there are two parallel lines, both moving down to the right across respective peaks (upper line) and bottoms (lower line).
#5 Channel Up
The Channel Up pattern is identified when there are two parallel lines, both moving up to the right across respective peaks (upper line) and bottoms (lower line).
#6 Falling Wedge
Falling Wedge are drawn using two converging trendlines; however, a wedge is characterized by the fact that both trendlines are moving in the same direction, either up or down.
#7 Rising Wedge
The rising wedge pattern is a bearish chart pattern that signals an imminent breakout to the downside. It’s the opposite of the falling (descending) wedge pattern (bullish), as these two constitute a popular wedge pattern.
#8 Rectangle
Rectangles, formations etched by parallel support and resistance levels, encapsulate a visual representation of market equilibrium—an intricate equilibrium within the financial confines.
#9 Head & Shoulders
Head & Shoulders pattern appears as a baseline with three peaks, where the outside two are close in height, and the middle is highest. The head and shoulders pattern forms when a stock’s price rises to a peak and then declines back to the base of the prior up-move
#10 Inverse Head & Shoulders
An inverse head and shoulders, also called a head and shoulders bottom, is inverted with the head and shoulders top used to predict reversals in downtrends.
#11 Triple Top
The triple-top pattern occurs when the price of an asset creates three peaks at nearly the same price level. The triple top pattern, a trilogy of peaks converging at nearly identical altitudes, weaves a tale of market resistance, a trifecta of challenges for the discerning trader.
#12 Triple Bottom
The triple bottom pattern means three equal lows followed by a breakout above the resistance. Conversely, the triple bottom pattern unfolds with three equidistant lows, culminating in a triumphant breakout above resistance—an allegory of resilience in the face of financial challenges.
#13 Flag
Flags are constructed using two parallel trendlines that can slope up, down, or sideways (horizontal). In general, a flag that has an upward slope appears as a pause in a down-trending market;
#14 Pennant
Pennants are drawn with two trendlines that eventually converge. A key characteristic of pennants is that the trendlines move in two directions—that is, one will be a down trendline and the other an up trendline.
#15 Double Top & Double Bottom
Double top and bottom patterns are chart patterns that occur when the prices of the stock move in a pattern that is similar to the letter “W”
In the realm of technical analysis, where precision meets complexity, an understanding of these chart patterns serves as a compass for navigating the labyrinthine landscape of the stock market. As we conclude this journey into the cryptic world of financial intricacies, may you find enlightenment in deciphering the enigmatic language of trading chart patterns.
 of the stocks.)